Issue #19 - Debugging HTML: Linting
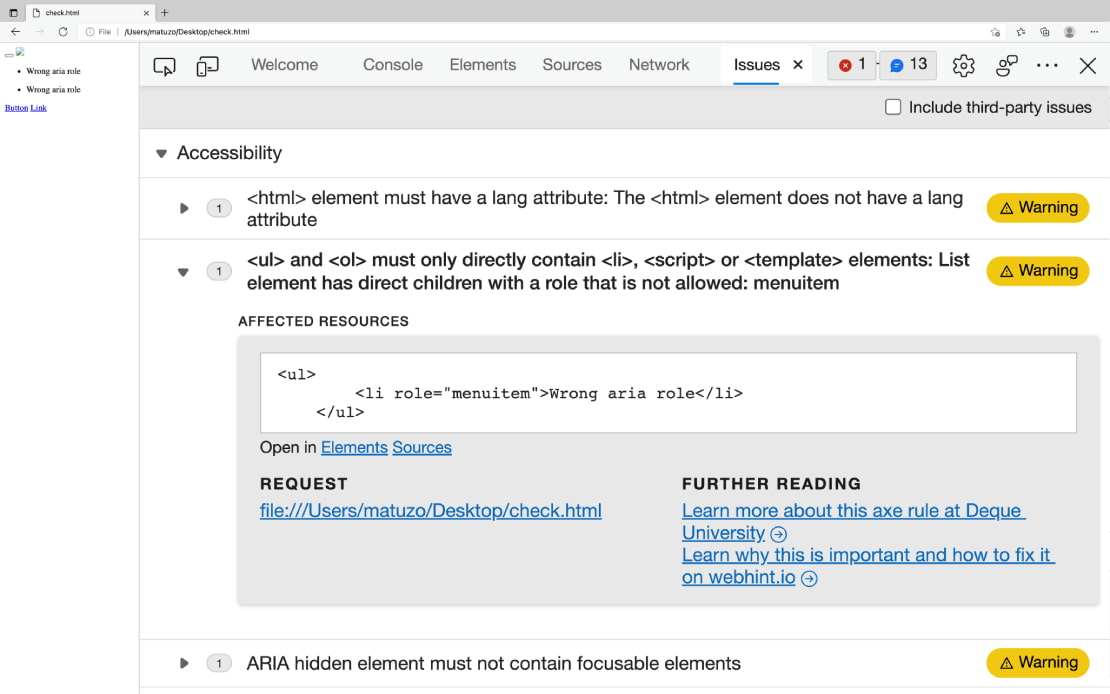
published onEdge highlights potential issues in your document directly in the elements panel of DevTools and it lists details and further issues in the issues panel.
One of my favourite features in Edge DevTools is the built-in linter that highlights potential issues in your HTML by marking affected elements with a squiggly yellow line.
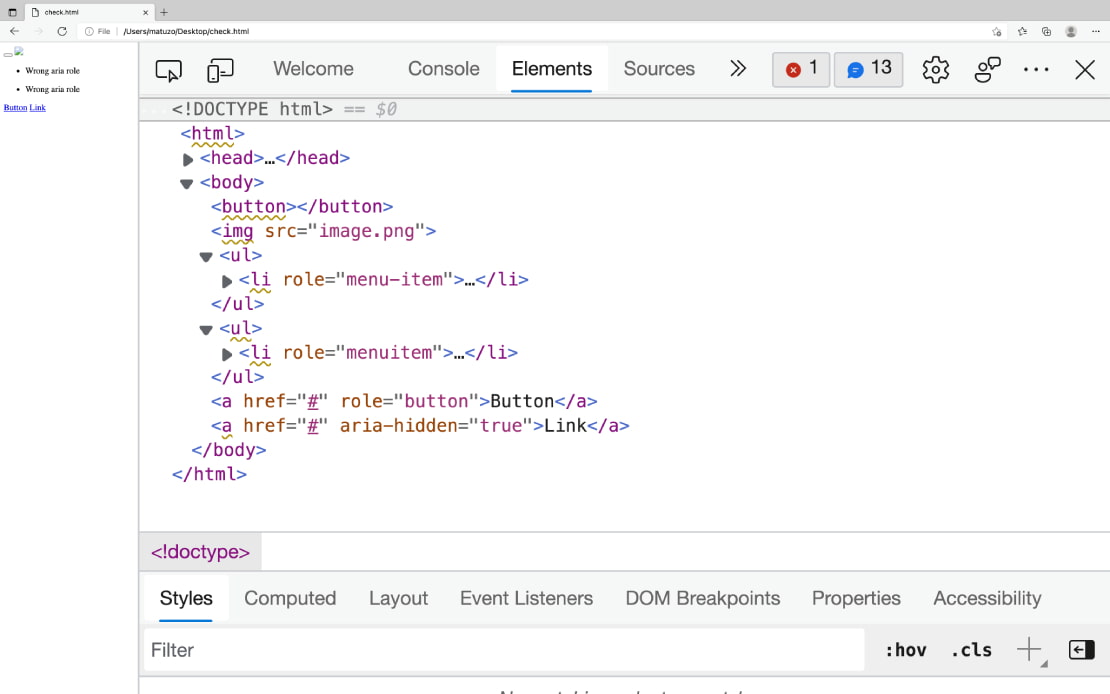
If you hover over the opening tag, a tooltip with a description of the issue appears. You can Shift + click or right-click it and select “View Issues” to view details about the issue or you can open the issues panel directly (CMD/Ctrl + Shit + P -> Show Issues) to get a list of all issues found on the page. The data is coming from axe, @mdn/browser-compat-data, and webhint.
You can also jump from the issues panel directly to the affected element in the elements or sources panel, and there are links to learning resources.
To learn more about this feature, check out the links in the resources section of this page.
Resources
Did you enjoy this tip?
Sign up for the HTMHell newsletter and receive an HTML tip or trick every week via e-mail.